Module 03
Forecasting: what should operations prepare for before demand arrives?
Forecasts do not make uncertainty disappear. They help managers decide how much capacity, inventory, staffing, and service flexibility to put in place.

This Week
Learn. Practice. Apply.
03
Sunday · Sep 13
11:59 PM
Homework 2: Forecasting
Practice the forecasting methods and analysis introduced this week.
04
Sunday · Sep 13
11:59 PM
Case Study 1 Due
Submit the first team case-study deliverable.
05
Saturday · Sep 19
1:00-3:50 PM
Saturday Online Session
This session is online. I will also be in Trustee Hall 216 if you want to join in person and connect with your group.
Agenda
Today moves from why forecasts matter to which tool fits the decision.
01
Why forecasting matters
02
Models and useful simplification
03
Time series patterns
04
Moving average and forecast error
05
Exponential smoothing
06
Regression and multiple regression
07
Judgment, crowds, and tool choice
Forecasting and the Value Chain
The forecast becomes an input to almost every downstream operating decision.
Demand forecasts shape staffing, equipment, space, and service capacity decisions.
Forecasts help balance stockouts, carrying cost, obsolescence, and service levels.
Forecasts guide labor schedules, production timing, purchasing, and delivery promises.
Modeling Mindset
“All models are wrong, some are useful.”
George Box
The managerial question is not whether a forecast is perfect. It is whether the model improves the decision enough to be trusted.
Models
A model is a simplified representation of reality built for a decision.
A useful forecast does not copy the world perfectly. It improves the next operating choice enough to be worth trusting.
Useful Means
Fit
Does the model capture a real pattern?
Forecast
Does it perform when new demand arrives?
Decision
Does it change a management action?
Cost
Is it worth the effort and complexity?
Useful Distortion
The Mercator map distorts size, but it was still useful for navigation.
Forecasting models work the same way: every simplification leaves something out. The question is whether the simplification helps the decision.
What Gets Distorted?
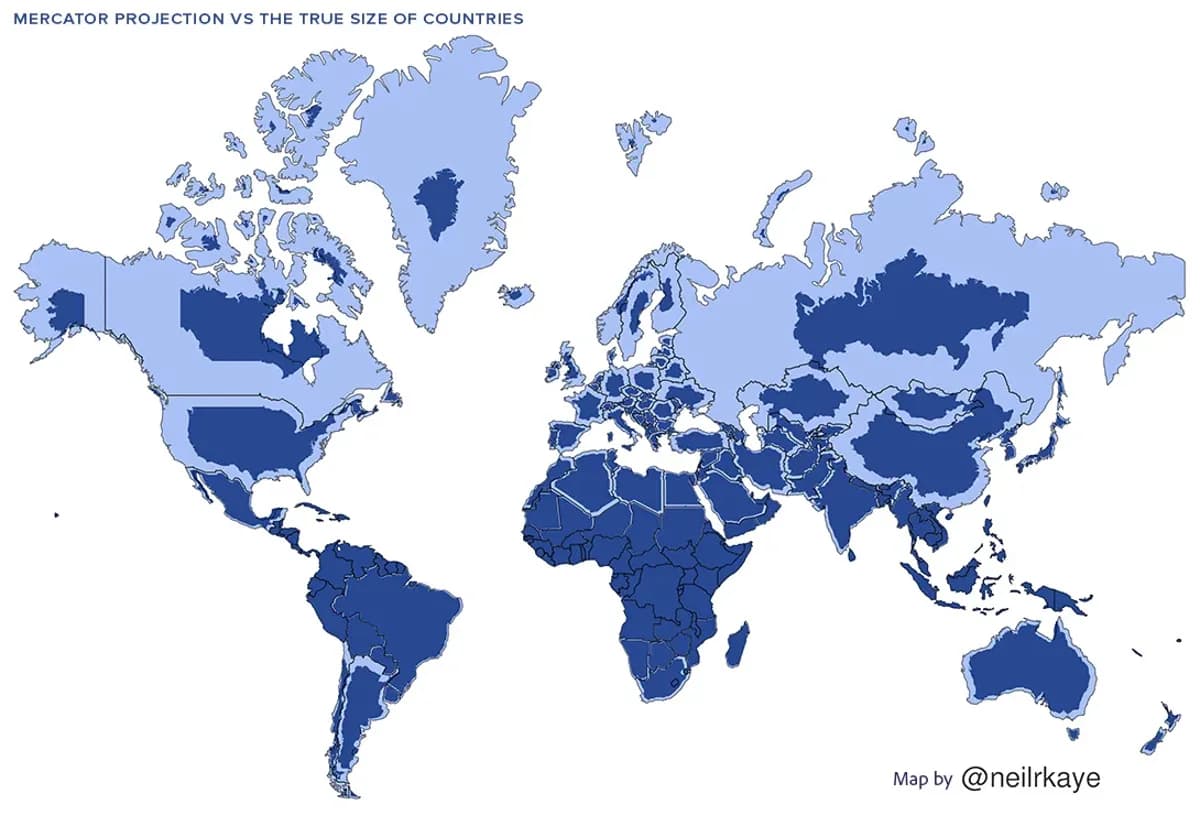
The lesson for forecasting: a model can be useful for its intended purpose and still distort reality in ways managers need to notice.
Tomorrow vs. Next Year
Forecast horizon changes the kind of decision the forecast can support.
Useful for staffing, replenishment, daily scheduling, and immediate service recovery.
Useful for purchasing, workforce planning, promotions, and inventory targets.
Useful for capacity, facilities, suppliers, technology, and strategic commitments.
Time Horizon
A forecast is only useful when its horizon matches the decision.
A coffee shop is planning demand across daily operations, seasonal promotions, and future growth. Sort each decision into the forecast horizon it needs.
Time Series
Time series data is ordered over time, and that order matters.
Demand rises or falls over a sustained period.
Demand changes by day, week, month, quarter, holiday, or semester rhythm.
Demand moves through expansions and contractions without a fixed calendar period.
Demand changes for reasons the model does not explain.
Concept
A moving average uses recent history to smooth out noisy demand.
It is simple, explainable, and useful when demand is relatively stable.
Choose a window, such as the last three periods.
Average the most recent observations.
Move the window forward as new demand arrives.
Use the forecast as an input to staffing, inventory, or capacity decisions.
Decision First
Demand is stable but noisy. Would you use a shorter or longer moving average window?
Take a position before touching the slider. Then compare your prediction to what the forecast line actually does.
Which window choice fits stable but noisy demand?
Interactive Idea
Change the moving-average window and feel the tradeoff.
A shorter window follows demand faster. A longer window smooths the noise, but it can lag behind real changes.
Moving average window
3-period MA
Manager Takeaway
Balanced choice when demand is fairly stable but not perfectly smooth.
Demand vs. moving average
Responsiveness
68%
Smaller windows react quickly to recent changes.
Smoothing
66%
Larger windows calm noisy demand.
Lag
58%
More smoothing usually means slower reaction.
Build the Forecast
Use a short demand history to calculate a simple moving average, then copy the logic forward.
Model Notes
Forecast_t = average of the last n actual periods
3-period MA = (A_t-1 + A_t-2 + A_t-3) / 3
Copy formulas forward; do not hard-code results.
How Wrong Were We?
A forecast is only useful if we measure the miss and learn from it.
The basic miss for a period. Direction matters when you want to know bias.
Useful when size of the miss matters more than direction.
A forecast can be wrong in a pattern, not just wrong by accident.
Diagnose Before You Adjust
Forecast error is not just a score. It can tell you what the model is missing.
Good managers do not just ask whether the forecast was wrong. They ask what kind of wrong it was.
Bias
Consistently too high or too low
If the forecast keeps missing in the same direction, the model may be systematically overforecasting or underforecasting demand.
Manager question
Are we repeatedly preparing too much or too little?
Lag
The model reacts too slowly
If actual demand shifts but the forecast trails behind, the model may be smoothing too aggressively or reacting too slowly to change.
Manager question
Is the forecast too slow for the way demand is changing?
Missed Seasonality
Repeating peaks are not captured
If the same spikes or dips keep returning on a known rhythm, the model may be ignoring calendar-driven demand patterns.
Manager question
Are we missing a weekly, monthly, or holiday pattern?
Noise
Random variation remains
Some forecast error is not fixable. If misses look irregular and patternless, the model may already be doing as much as it reasonably can.
Manager question
Is this a model problem, or just normal randomness?
Learning goal: students should move from “the forecast missed” to “the miss suggests bias, lag, missed seasonality, or normal noise.”
Error Metrics
Different error metrics answer different management questions.
A forecast is not “good” or “bad” in the abstract. Managers need a way to measure how wrong it was and whether that level of error is acceptable for the decision.
MAD
MetricMean Absolute Deviation
What it tells you
Average size of the forecast miss in demand units.
Why managers use it
Easy to explain and stays in the original units.
Watch out
Does not punish very large misses as strongly as squared-error measures.
MSE
MetricMean Squared Error
What it tells you
Average squared forecast error.
Why managers use it
Penalizes large misses more heavily.
Watch out
Harder to interpret because units are squared.
RMSE
MetricRoot Mean Squared Error
What it tells you
Square root of MSE, so error returns to original units.
Why managers use it
Useful when large misses are especially costly.
Watch out
More sensitive to outliers than MAD.
MAPE
MetricMean Absolute Percentage Error
What it tells you
Average forecast miss as a percentage of actual demand.
Why managers use it
Useful for comparing error across products or scales.
Watch out
Can behave badly when actual demand is zero or very small.
Manager shortcut: Use MAD when you want an intuitive average miss in units, RMSE when big misses are especially painful, and MAPE when you need percentage-based comparison across different products or scales.
Concept
Exponential smoothing updates the forecast by learning from the latest error.
Alpha controls how strongly the forecast reacts to new information.
Start with a prior forecast.
Observe actual demand.
Update the forecast by weighting the latest error.
Use a higher alpha when recent demand should matter more.
Decision First
Demand just jumped sharply. Should alpha be higher or lower?
Commit first, then use the alpha slider to see how much the forecast chases the new information.
Which alpha choice reacts better to a real demand jump?
Interactive Idea
Adjust alpha and watch the forecast line change.
Alpha controls how much the forecast learns from the most recent error. High alpha reacts quickly; low alpha is smoother and slower.
Smoothing constant
alpha = 0.4
F_next = F_current + alpha(Actual - Forecast)
What This Means Operationally
Good general-purpose compromise.
Actual demand vs. forecast
Reaction
58%
High alpha reacts faster to recent demand.
Smoothing
64%
Low alpha keeps the line steadier.
Lag
58%
Low alpha can trail behind a real shift.
Change Alpha / Compare
Build the same demand forecast with two alpha values and compare responsiveness.
Model Notes
F_t+1 = F_t + alpha(A_t - F_t)
Higher alpha = faster reaction
Lower alpha = smoother, slower reaction
What Drives Demand?
The regression equation connects an outcome to one or more drivers.
The mathematical foundation of linear regression becomes a forecasting tool when Y is demand and X is a demand signal.
Simple Linear Regression
Y = b0 + b1X + e
Y (Dependent)
What we're trying to predict. In operations, this is often demand.
b0 (Intercept)
The baseline forecast when the driver equals zero.
b1 (Slope)
How much forecasted demand changes when X increases by 1.
e (Error)
Random variation the model cannot explain.
Multiple Linear Regression
Y = b0 + b1X1 + b2X2 + ... + bkXk + e
Model Fit
R2 asks: how well does the model explain the data?
Higher R2 means the model explains more variation in the outcome, but it does not prove causation or guarantee the next forecast will be accurate.
R2 -> 1
Good fit. Explains most variance.
R2 -> 0
Poor fit. Explains little variance.
Comparing Forecast Models
Model 1
Price only
0.28
Model 2
+ Weather + Promotion
0.40
Model 3
+ Calendar
0.45
Decision First
If Model A has a higher R-squared, should the manager always prefer it?
Make the call after seeing the R-squared slide. The goal is to separate statistical fit from managerial usefulness.
Should the highest R-squared automatically win?
Which interpretation is most useful for a manager?
More Than One Driver
Multiple regression lets the forecast include several demand signals at once.
The forecast target stays focused: sales, arrivals, orders, visits, or another operating result.
Price, promotions, weather, day of week, season, and local events can all contribute signal.
More predictors can improve prediction, but also increase overfitting and interpretation mistakes.
Multiple Regression
Move from one driver to several, then decide whether the added complexity is worth it.
Model Notes
Y = b0 + b1X1 + b2X2 + ... + error
Each coefficient estimates one driver while holding the others in the model.
Judge the model by usefulness, not decoration.
Repeating Patterns
Seasonality is predictable variation that repeats on a calendar or operating rhythm.
Demand can move by hour, day, week, month, semester, holiday, or fiscal cycle.
A monthly average can hide predictable peaks that still require staffing and inventory.
Good forecasts translate repeating demand into schedules, stock, capacity, and service plans.
When the Data Doesn't Know
Judgment helps when the model cannot see something the manager already knows.
New products, new markets, and new policies may require expert judgment.
Weather events, supply shortages, competitor moves, and policy changes can break a model.
Managers may know about marketing, price, or service changes before the data shows them.
Judgment at Scale
Groups can improve forecasts when individual signals are independent and incentives are well designed.
Independent estimates can cancel out some individual blind spots.
Markets can turn dispersed knowledge into a probability-like signal.
Groupthink, incentives, bad information, and correlated errors can make crowds confidently wrong.
Decision Guide
Pick the tool based on the demand pattern, data, horizon, and decision risk.
Stable history
Moving average
Smooth noise and stay explainable.
Recent changes matter
Exponential smoothing
React faster or slower by adjusting alpha.
Known drivers
Regression
Use price, weather, promotion, or calendar signals.
No clean history
Judgment
Use expertise, analogs, crowds, or scenarios.
Which statement is the best management interpretation of model fit?
Group Challenge
Choose A Model For Each Demand Pattern
Coffee sales at a nearby Starbucks
What data, method, judgment, and operating decision would you connect to this forecast?
Attendance at a UT vs Texas A&M football game
What data, method, judgment, and operating decision would you connect to this forecast?
Daily electricity demand in Austin
What data, method, judgment, and operating decision would you connect to this forecast?
Stock price of a major company
What data, method, judgment, and operating decision would you connect to this forecast?
Cumulative Review
One last check: can you connect the method, the metric, and the decision?
These questions mix concepts from across the lecture. The goal is to retrieve, compare, and apply what you learned before the final wrap-up.
Demand just changed sharply and recent observations matter most. Which forecasting approach is usually the best starting point?
A regression model has a higher R-squared than another model. What does that mean?
If large forecast misses are especially expensive, which error metric should matter more?
When should a manager override the model with judgment?
What success looks like: students should be able to choose a method, interpret fit carefully, connect metrics to consequences, and know when judgment adds value.